Reports
Reports (under Reports in the sidebar) turns measurement into a client-ready decision: what changed, why it matters, and the next recommendation. It produces PDFs and controlled public links, while every claim remains tagged OBSERVED or INFERRED with its methodology.
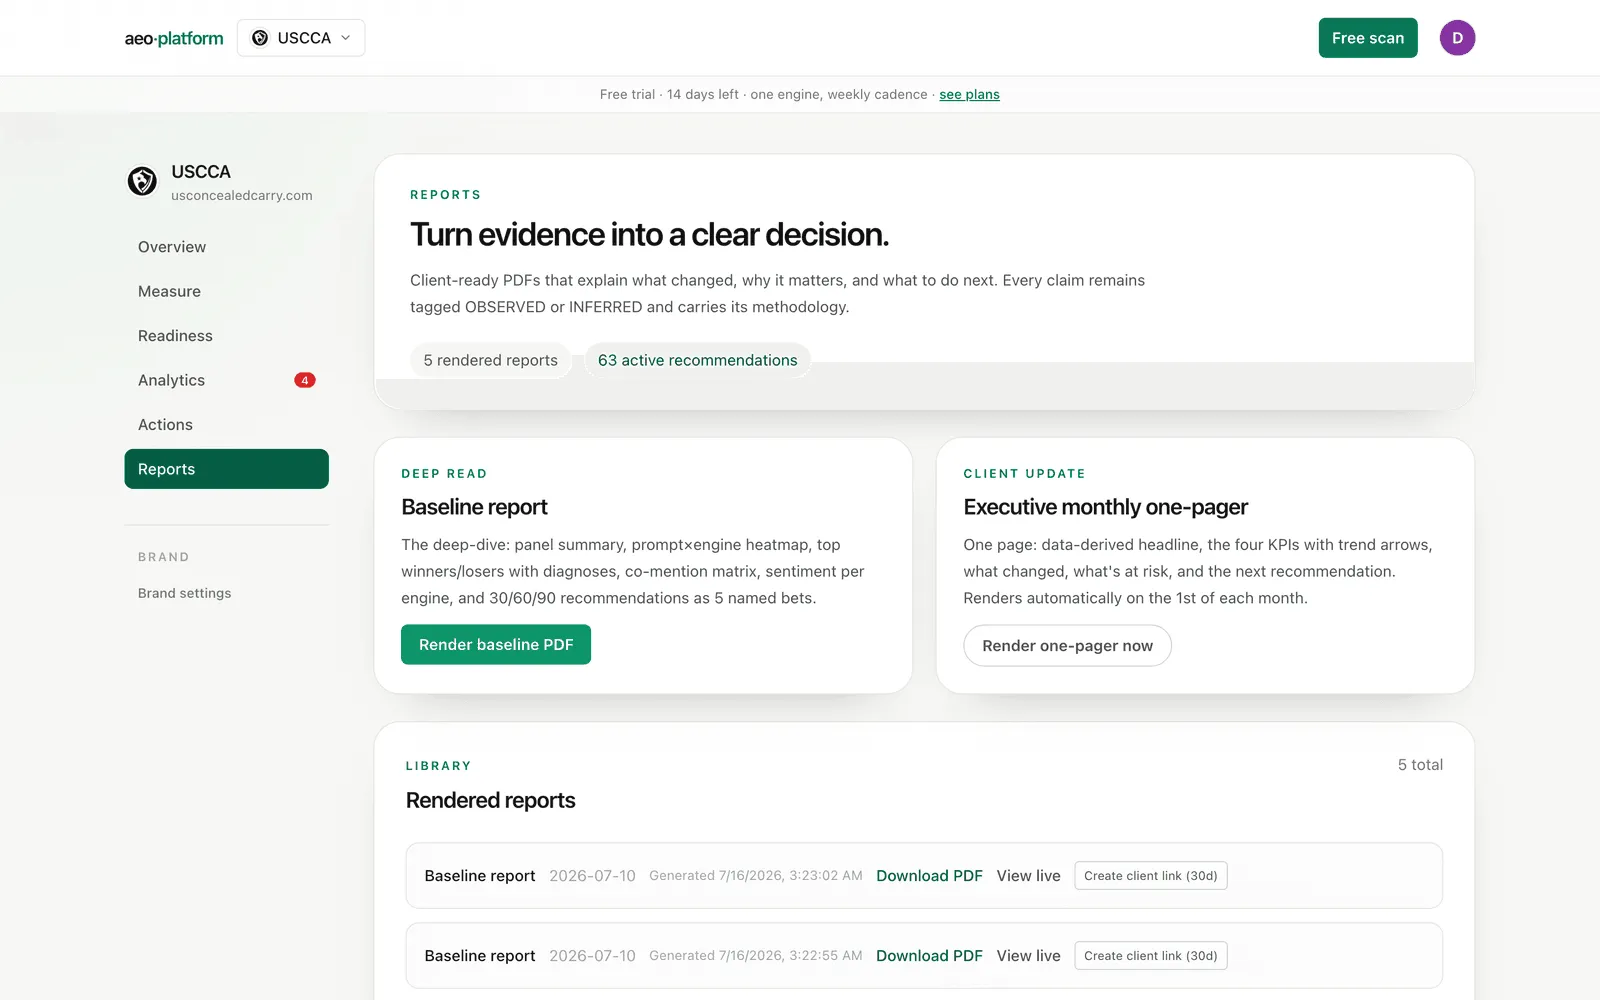
The two report types
Section titled “The two report types”At the top are two cards, one per report type:
- Baseline report — the deep-dive: panel summary, prompt × engine heatmap, top winners and losers with diagnoses, co-mention matrix, sentiment per engine, and 30/60/90 recommendations framed as five named bets. This is the document for a kickoff or a quarterly review.
- Exec monthly one-pager — a single page: a data-derived headline, the four KPIs with trend arrows, what changed, and what is at risk. It renders automatically on the 1st of each month for every brand with a completed check, and you can render one on demand any time.
Click Render baseline PDF (or Render one-pager now) and a new row appears in the rendered list below.
Both buttons stay disabled until the brand has at least one completed measurement — there is nothing truthful to report before that, so the page says so instead of rendering an empty document. Run a measurement from Measure first.
The rendered list
Section titled “The rendered list”Each rendered report is a card showing its type, the period it covers, and when it was created. A fresh card reads rendering… for a short while, then gains a Download PDF link. Every card also has a View live link that opens the same report as a web page, useful for a quick look without downloading.
Share links
Section titled “Share links”This is the part clients actually touch. For any report with a finished PDF, click Create client link (30d). You get a public URL of the form /share/<token>:
- No login needed. Anyone with the URL sees the report. The token is unguessable, so the link is only as public as you make it.
- View count. Each link shows how many times it has been opened, with the last-viewed time on hover — so you know whether the client actually looked at it. Views count page loads, not unique people.
- Expiry. Links expire 30 days after creation; the expiry date is shown next to each link, and an expired link is labeled clearly.
- Revoke. Click revoke to kill a link immediately. A revoked or expired URL shows a clear “not valid” state to the visitor instead of the report.
You can create several links for the same report (for example, one per recipient) and revoke them independently.
Share links are also how you show a prospect their numbers before they are a client: a view-tracked link tells you whether the report landed on someone’s screen before the follow-up call.