Alerts
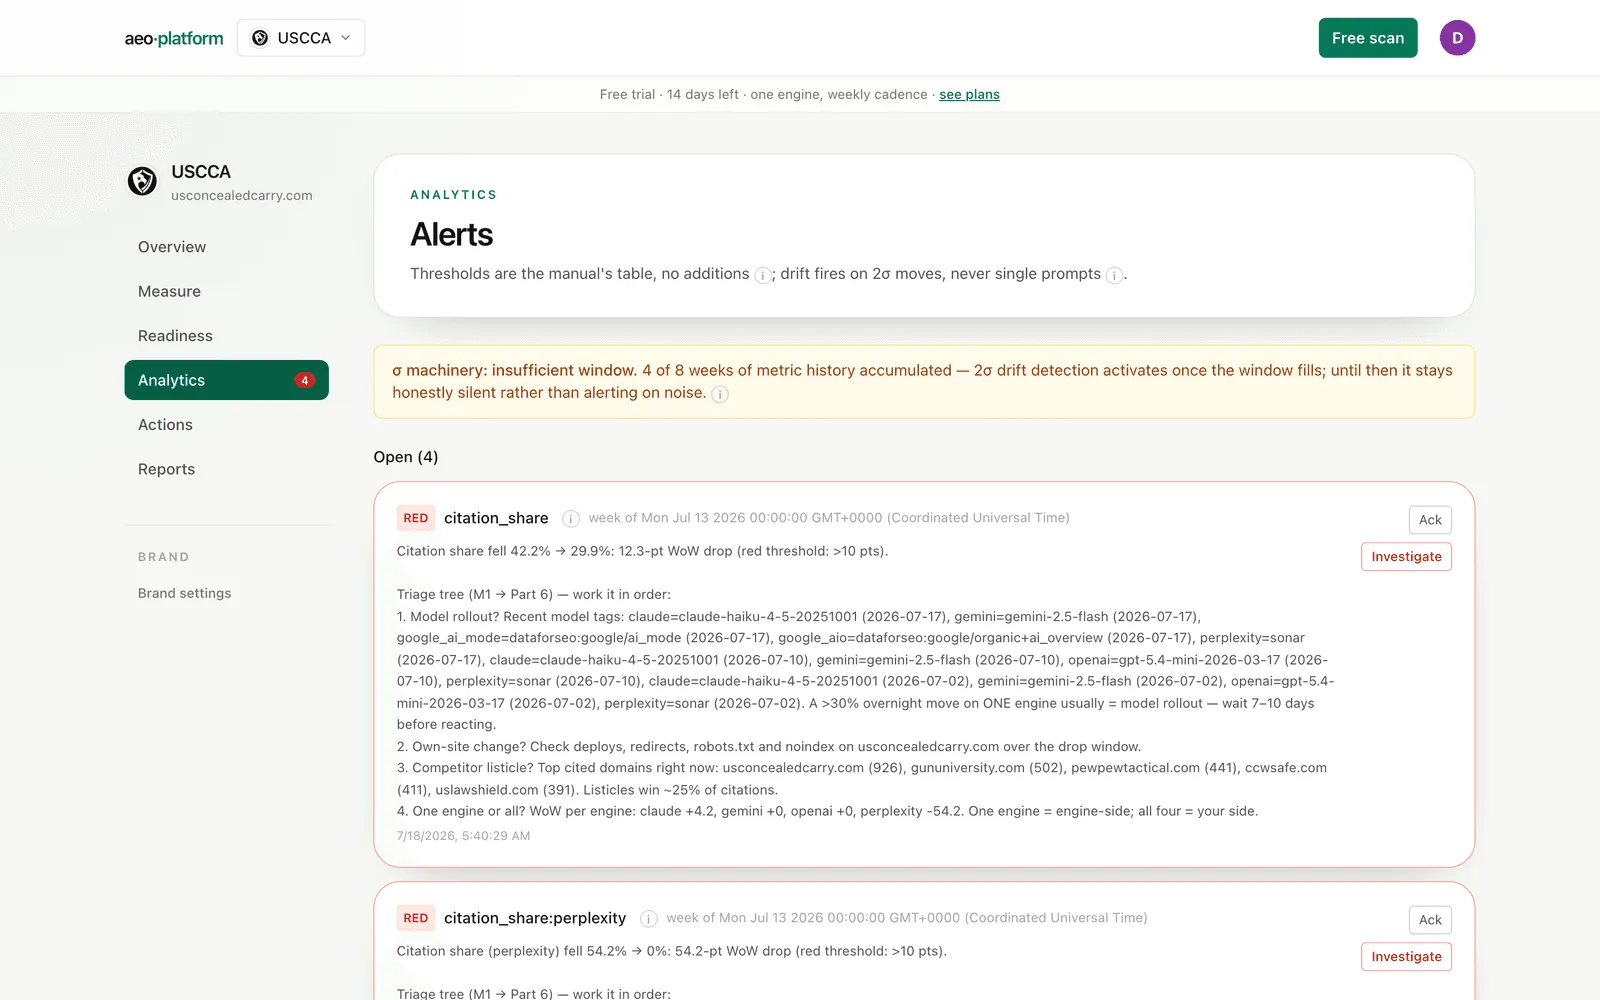
Alerts (under Analytics in the sidebar; the Analytics entry carries a badge when alerts are open) is the screen that tells you when something meaningfully moved. Alerts are evaluated once a day, right after the day’s metric snapshot, from two mechanisms: fixed thresholds from the methodology’s table (no additions, no tightening) and statistical drift — a metric moving more than two sigma from its 8-week mean. Nothing here fires on a single answer or a single prompt.
The history banner
Section titled “The history banner”The colored banner at the top reports the state of the drift detector. Until eight weeks of metric history exist, it reads “insufficient window — N of 8 weeks”: the 2-sigma machinery stays deliberately silent rather than alerting on noise, and the banner tells you exactly how far along the window is. Once the window fills, the banner turns green and drift detection is live.
A quiet Alerts screen in a brand’s first two months is the tool working as designed, not a missing feature. The same honesty applies to each individual check: any check that lacks the history it needs (say, a week-over-week comparison with only one week stored) is skipped with an explicit “insufficient window” reason, never faked.
What can fire
Section titled “What can fire”- Citation share drops — week-over-week and month-over-month falls past the yellow or red thresholds, per engine and blended.
- Drift — any tracked metric moving beyond 2 sigma from its 8-week mean.
- Crawler volume drops — a verified AI crawler’s weekly visits falling sharply. This is the leading indicator: crawling precedes citation by roughly a month.
- Branded search impressions drops, new schema errors between audit rounds, an engine getting a 404 on your
llms.txt, and published content whose scheduled refresh date has passed.
Reading an alert card
Section titled “Reading an alert card”Open alerts are listed first, acknowledged ones below (dimmed). Each card shows a red or yellow severity badge, the metric, the time window, and when it fired.
The body does more than state the drop: for visibility alerts it walks the triage tree with your live data filled in, in the order you should check —
- Model rollout? The card lists the actual engine model versions seen across your recent checks. A big overnight move on one engine usually means the engine changed, not you; wait a week before reacting.
- Own-site change? Deploys, redirects, robots rules on your domain over the drop window.
- Competitor listicle? The card names the domains currently winning citations on your panel.
- One engine or all? The card shows the per-engine week-over-week deltas. One engine moving is engine-side; all of them moving is your side.
Acting on an alert
Section titled “Acting on an alert”Every open card has an Ack button — acknowledging moves it to the dimmed list so the open count reflects what still needs attention.
Red alerts additionally offer Investigate: one click launches a fresh check of every question per engine at the platform’s configured pass count, so you can separate a real change from normal answer-to-answer variance before you escalate to a client. It uses the same billing gate and in-flight guard as the other run buttons.
Related
Section titled “Related”- Why it stays quiet at first: insufficient window in the glossary, and the honest-empty-states idea generally.
- What to do about a confirmed problem: Action plan.
- The metrics being watched: Scorecard.